Radionics - SE5 plus
SE5 plus
|

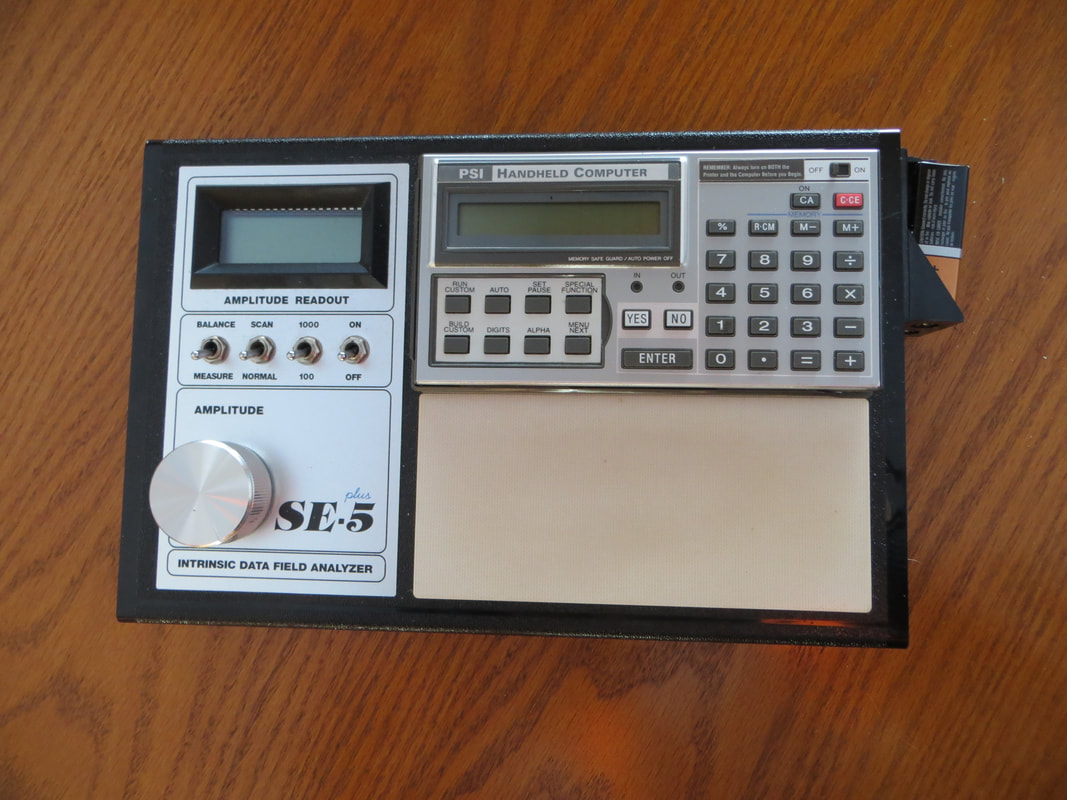
The practice of Radionics involves working in the subtle information fields that are slightly beyond the grasp of the 3D human senses. The concepts are based on the idea that everything is energy and holds a perfect vibrational blueprint (DNA). All things are energetically connected over time and space. The SE5 (pictured on the left) enhances one’s ability to work in these subtle fields to balance and alter vibrational information for optimum vibrant health. Based on the blueprint, vibrational information is sent to the plants, re-enforcing and balancing. Yields and quality will soar.
|
Refractometer
|
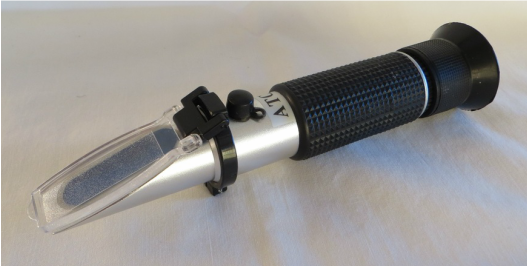
A refractometer measures the sugar content of a liquid. Sugar content of the sap from a plant or fruit represents the nutritional value of the plant. To measure this sugar (nutrient) content of the plant, simply squeeze some juice (a couple of drops) from a leaf, stem, fruit, or root on the refractometer screen and look thru the eye piece. You will see a line which represents the percent (%) BRIX of the plant. The higher the BRIX, the more nutritious and healthier the plant!
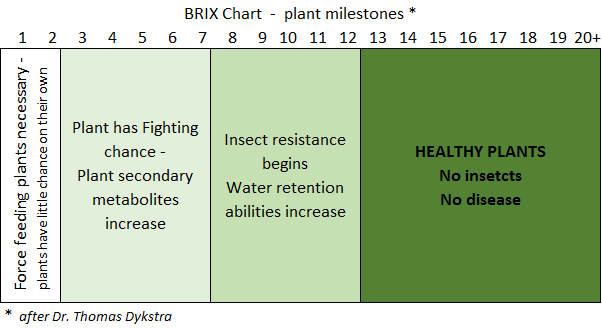
BRIX is essentially the measurement of the sugar or sucrose content. During photosynthesis, the plant takes up water, sunlight, and nutrients, combines them in this magical process and makes sugar (carbohydrate). BRIX is like a fuel gage, measuring the health of the plant. High BRIX means healthy/nutritious plant and therefore healthy soil! The top portion of the plant will generally have a higher BRIX than the bottom of the plant. The more out of balance the soil is, the higher the variance in BRIX between the top and bottom of the plant. Consistency in testing (same location on the plant, same time of day) will produce interpretable diagnostic results. Table on left summarizes the BRIX values and thresholds for various plant milestones. On a hot sunny day, a healthy plant with 12%-14% BRIX will grab moisture out of the air, alleviating drought conditions. |
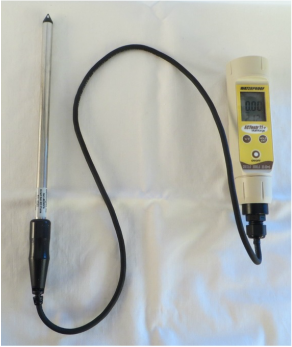
EC (Electrical Conductivity) Meter
|
An EC Meter (on the left) measures the electrical conductivity of the soil (how well electricity flows between negative and positive conductors). Each microbe is capable of creating 1/2 volts of electricity, and in a spoonful of healthy soil, there can be up to 500,000 volts of contained energy. The EC Meter measures in milli siemens (mS). In ideal conditions, soil electrical conductivity will be 400 – 800 mS.
Electrolyte elements also produce a charge, so if there is excess potassium (salt), magnesium, or sulphur in the soil, EC readings will be high, reflecting inorganic activity as opposed to organic (microbe) activity. Generally salts and sodium are near the surface, so it is good to measure the variation of EC over the soil column. The Table below summarizes EC ranges and tolerances for plants. |
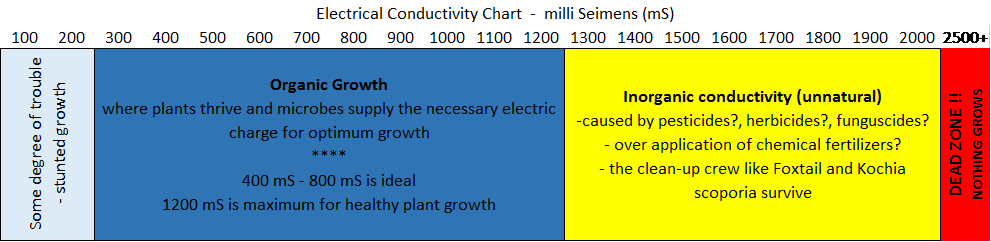
Electrical Conductivity Chart and tolerances for plants
Penetrometer
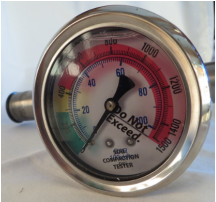
A Penetrometer (picture below) measures the compaction of the soil. Soil with a compaction between 0 and 300 psi is ideal for plants and root growth. Compaction from 300 to 400 psi is the transition zone where root growth is possible but challenging. Compaction higher than 400 reflects very tight soil where crops have difficulty penetrating the soil with their roots. This corresponds directly to the structure of the soil and the Aerobic Zone (0-300psi) and the Anaerobic Zone (400+psi).
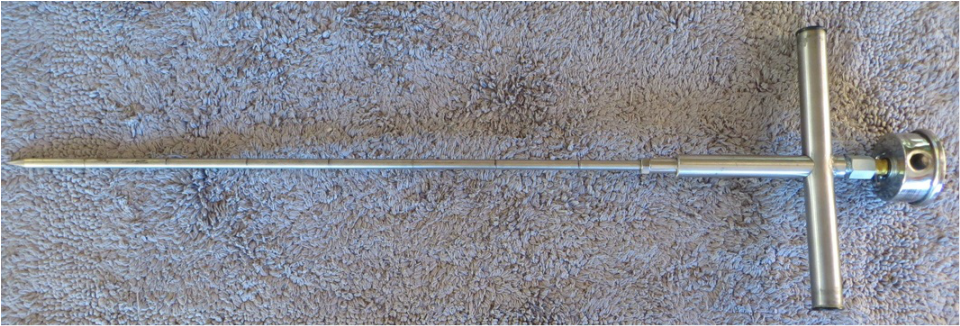
Penetrometer (with detail of dial)